条形图与箱线图
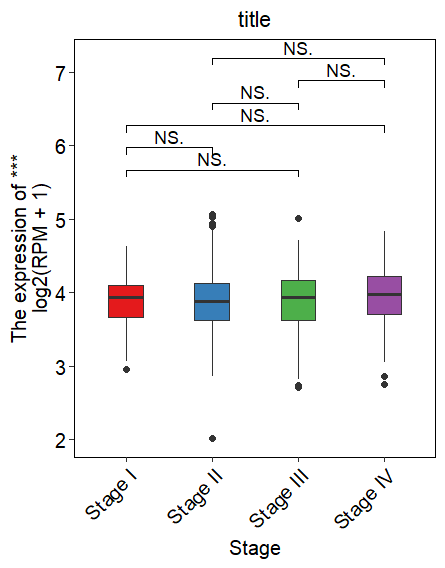
1.箱型图
library(ggplot2)
library(grid)
library(RColorBrewer)
library(dplyr)
library(ggpubr)
library(SuppDists) #提供rJohnson()函数
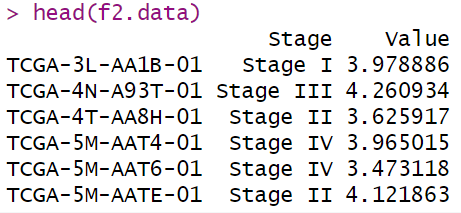
数据样式:
绘图:
# 统计检验的分组比较信息
compaired <- list(c("Stage I" ,"Stage III"),
                  c("Stage I","Stage II"),
                  c("Stage I","Stage IV"),
                  c("Stage III","Stage II"),
                  c("Stage III","Stage IV"),
                  c("Stage II" ,"Stage IV"))
ggplot(f2.data,aes(Stage,Value,fill= Stage))+
  geom_boxplot(aes(fill = Stage),notch = FALSE,
               position = position_dodge(width =0.01,preserve = "single"),
               outlier.alpha  =1,width=0.4) +
  scale_fill_manual(values = c(brewer.pal(5,"Set1")))+
  geom_signif(comparisons = compaired,
              step_increase = 0.1,
              map_signif_level = T,
              margin_top = 0.2,
              test = "wilcox.test")+
  labs(y= paste0("The expression of ***","\nlog2(RPM + 1)"),title= "title")+
  theme_classic()+
  theme(panel.background=element_rect(fill="white",colour="black",size=0.25),
        plot.title = element_text(hjust = 0.5),
        axis.line=element_line(colour="black",linewidth=0.25),
        axis.title=element_text(size=10,face="plain",color="black"),
        axis.text.x = element_text(angle = 45,face = "plain",colour = "black",hjust=1,vjust=1),
        axis.title.x=element_text(size=12,face="plain",color="black"),
        axis.title.y=element_text(size=12,face="plain",color="black"),
        axis.text = element_text(size=12,color="black"),
        legend.position="none"
  )
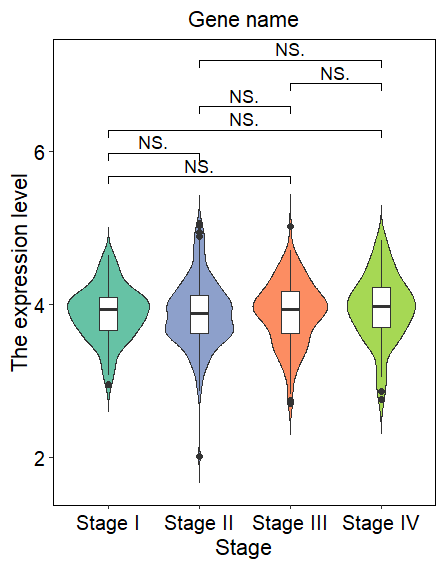
2.小提琴图
ggplot(f2.data, aes(Stage,Value))+
  geom_violin(aes(fill = Stage),trim = FALSE)+
  geom_boxplot(width = 0.2)+
  scale_fill_manual(values=c(brewer.pal(5,"Set2")[c(1,3,2,5)]))+
  theme_classic()+
  geom_signif(comparisons = compaired,
              step_increase = 0.1,
              map_signif_level = T,
              margin_top = 0.2,
              test = "wilcox.test")+
  labs(x='Stage',y='The expression level',title='Gene name')+
  theme(panel.background=element_rect(fill="white",colour="black",size=0.25),
        axis.line=element_line(colour="black",linewidth = 0.25),
        axis.title=element_text(size=13,face="plain",color="black"),
        axis.text = element_text(size=12,face="plain",color="black"),
        plot.title = element_text(hjust = 0.5) , # 明确设置标题水平居中,虽然这通常是默认的
        legend.position="none"
  )
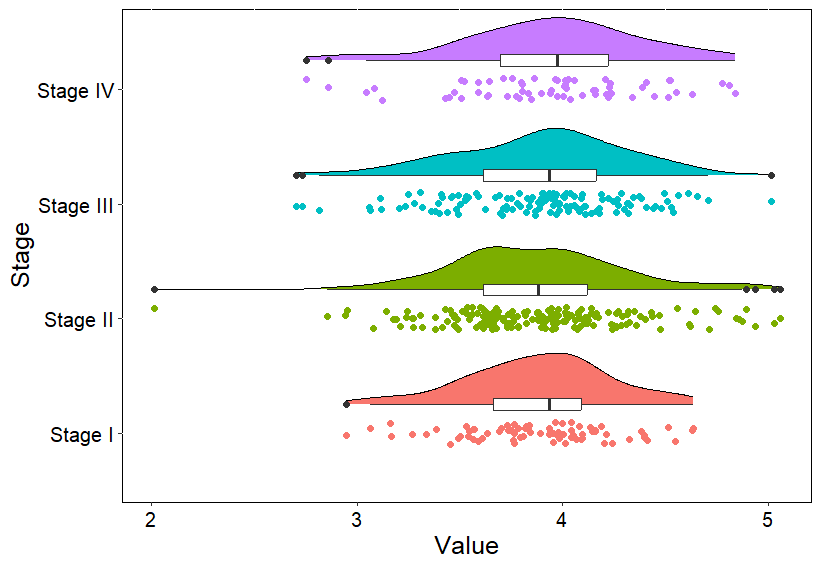
3. 云雨图
##云雨图
###自定义2个函数,来自https://github.com/hadley/ggplot2/blob/master/R/geom-violin.r
"%||%" <- function(a, b) {
  if (!is.null(a)) a else b
}
geom_flat_violin <- function(mapping = NULL, data = NULL, stat = "ydensity",
                             position = "dodge", trim = TRUE, scale = "area",
                             show.legend = NA, inherit.aes = TRUE, ...) {
  layer(
    data = data,
    mapping = mapping,
    stat = stat,
    geom = GeomFlatViolin,
    position = position,
    show.legend = show.legend,
    inherit.aes = inherit.aes,
    params = list(
      trim = trim,
      scale = scale,
      ...
    )
  )
}
GeomFlatViolin <-
  ggproto("GeomFlatViolin", Geom,
          setup_data = function(data, params) {
            data$width <- data$width %||%
              params$width %||% (resolution(data$x, FALSE) * 0.9)

            # ymin, ymax, xmin, and xmax define the bounding rectangle for each group
            data %>%
              group_by(group) %>%
              mutate(ymin = min(y),
                     ymax = max(y),
                     xmin = x,
                     xmax = x + width / 2)

          },

          draw_group = function(data, panel_scales, coord) {
            # Find the points for the line to go all the way around
            data <- transform(data, xminv = x,
                              xmaxv = x + violinwidth * (xmax - x)) #利用transform函数为数据框mydata增加数据

            newdata <- rbind(plyr::arrange(transform(data, x = xmaxv), -y),
                             plyr::arrange(transform(data, x = xminv), y))
            newdata_Polygon <- rbind(newdata, newdata[1,])
            newdata_Polygon$colour<-NA

            newdata_Path <- plyr::arrange(transform(data, x = xmaxv), -y)

            ggplot2:::ggname("geom_flat_violin", grobTree(
              GeomPolygon$draw_panel(newdata_Polygon, panel_scales, coord),
              GeomPath$draw_panel(newdata_Path, panel_scales, coord))
            )
          },

          draw_key = draw_key_polygon,

          default_aes = aes(weight = 1, colour = "grey20", fill = "white", size = 0.5,
                            alpha = NA, linetype = "solid"),

          required_aes = c("x", "y")
  )
#开始绘图
d <- group_by(f2.data, Stage) %>%
  summarize(mean = mean(Value),
            sd = sd(Value))
head(d)
ggplot(f2.data, aes(x=Stage, y=Value))  +
  geom_flat_violin(aes(fill=Stage),position=position_nudge(x=.25),color="black") +
  geom_jitter(aes(color=Stage), width=0.1) +
  geom_boxplot(width=.1,position=position_nudge(x=0.25),fill="white",linewidth=0.5) +
  coord_flip() + ##坐标系
  theme(axis.title=element_text(size=15,face="plain",color="black"),
        axis.text = element_text(size=12,face="plain",color="black"),
        panel.background = element_rect(fill = "transparent",colour = "black"),
        plot.background = element_blank(),
        legend.position="none",
        plot.title = element_text(size=15, lineheight=.8,hjust=0.5, face="plain"),
        legend.margin = margin(t = 0, r = 0, b = 0, l = 0, unit = "pt"))